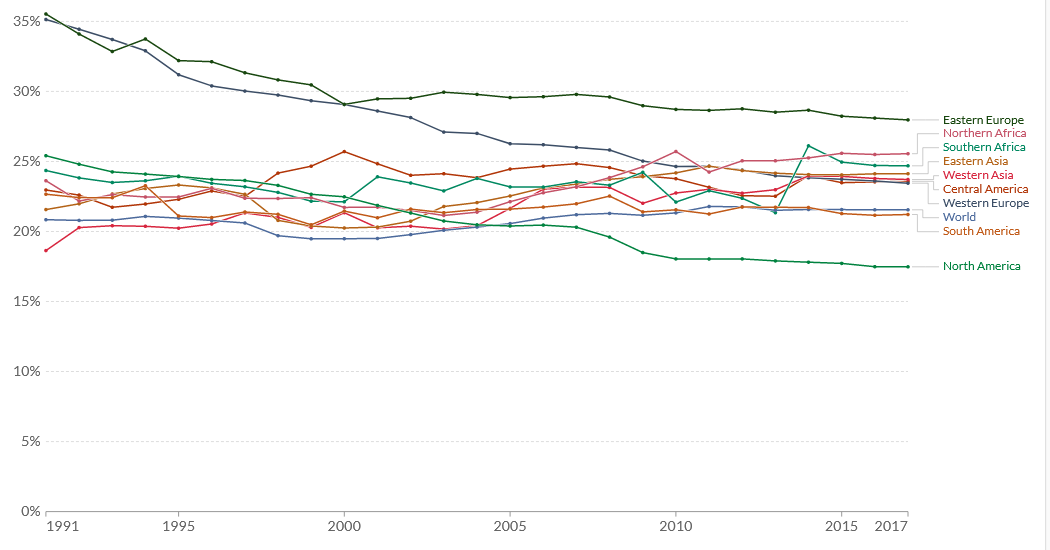
I downloaded a data set which shows the change in employment in industry per country over time between the years of 1991 and 2017. The CSV file for it was downloaded from Our World in Data and was chosen because it the difference in pattern between countries in different stages of development was intriguing.
This is the link to the data set. The original file does have a typo to the spelling of “employment.”
The following code chunk loads the package I will use to read in and prepare the data for analysis
- Read the data in
- Use glimpse to see the names and types of teh columns
glimpse(Industry_employment_1)
Rows: 7,344
Columns: 4
$ Entity                                                                  <chr> ~
$ Code                                                                    <chr> ~
$ Year                                                                    <dbl> ~
$ `Industry as % of total employment -- ILO modelled estimates, May 2017` <dbl> ~- Use output from glimpse to prepare the data for analysis.
Create the object “Continents” to filter out the specific country data sets and instead look at regional data and the world.
Change the name of the first column to ‘region’ and shorten the fourth column from “Industry as % of total employment – ILO modelled estimates, May 2017” to ‘employment’
Use
filterto extract the rows I want. I will keep all the year data set but will filter out individual countries.Select the columns to keep: Entity, year, and employment. We no longer need country code.
continents <- c("North America",
                "Northern Africa",
                "Southern Africa",
                "Central America",
                "Eastern Europe",
                "Western Europe",
                "South America",
                "Western Europe",
                "Eastern Asia",
                "Western Asia",
                "World")

regional_industry_employment <- Industry_employment_1 %>%
  rename(Region = 1, Employment = 4) %>%
  filter(Region %in% continents) %>%
  select(Region, Year, Employment)

regional_industry_employment
# A tibble: 270 x 3
   Region  Year Employment
   <chr>  <dbl>      <dbl>
 1 World   1991       20.8
 2 World   1992       20.8
 3 World   1993       20.8
 4 World   1994       21.1
 5 World   1995       21.0
 6 World   1996       20.8
 7 World   1997       20.6
 8 World   1998       19.7
 9 World   1999       19.5
10 World   2000       19.5
# ... with 260 more rows
Add a picture from the source, filtered to the same categories we are using.
Write the data to file in the project directory
write_csv(regional_industry_employment, file="Regional_industry.csv")